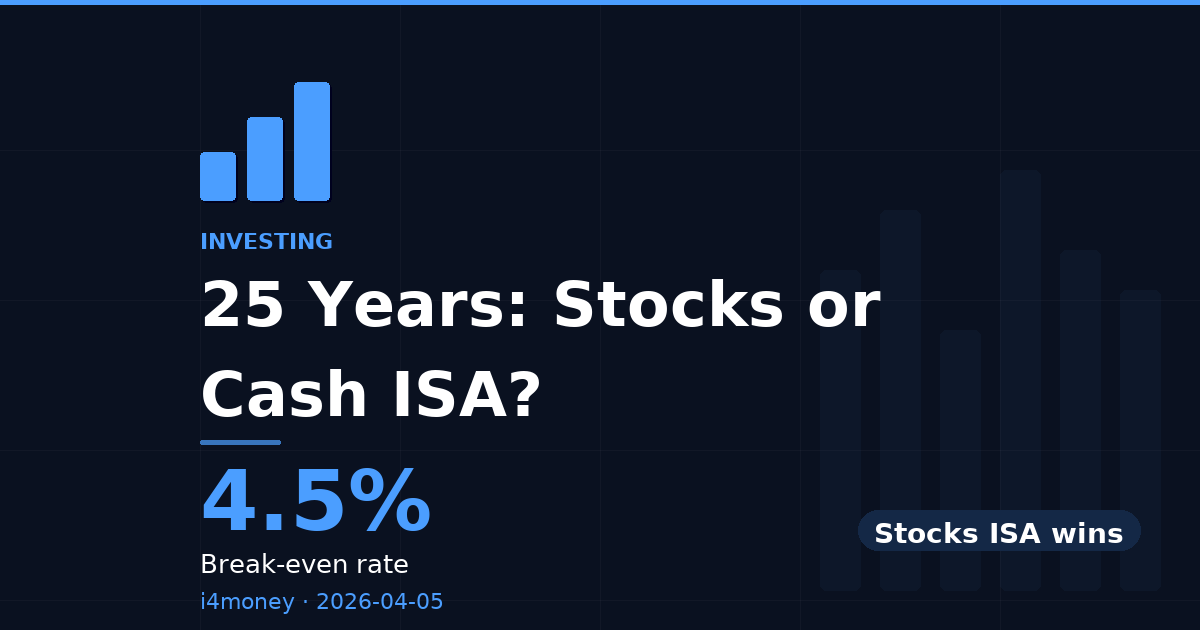
Stocks ISA vs Cash ISA: The Clear Winner
Verdict
Stocks ISA wins
Confidence: High
Break point: Equity return must stay above 4.5% every year over 25 years.
The rate that changes everything
The gap between stocks ISA and cash ISA terminal value widens significantly over longer horizons — compounding is the deciding factor.
The break-even equity return of 4.5% is the critical threshold that determines the superiority of the Stocks ISA over the Cash ISA; if the expected return on stocks falls below this rate, the Cash ISA, with its guaranteed 4.5% interest, becomes the better option. Conversely, any anticipated return on stocks exceeding 4.5% clearly favors the Stocks ISA, making it the more lucrative choice for investors seeking growth. Therefore, investors must focus solely on this benchmark: returns below 4.5% necessitate a shift to the Cash ISA, while returns above it validate the risk associated with the Stocks ISA.
Worked example
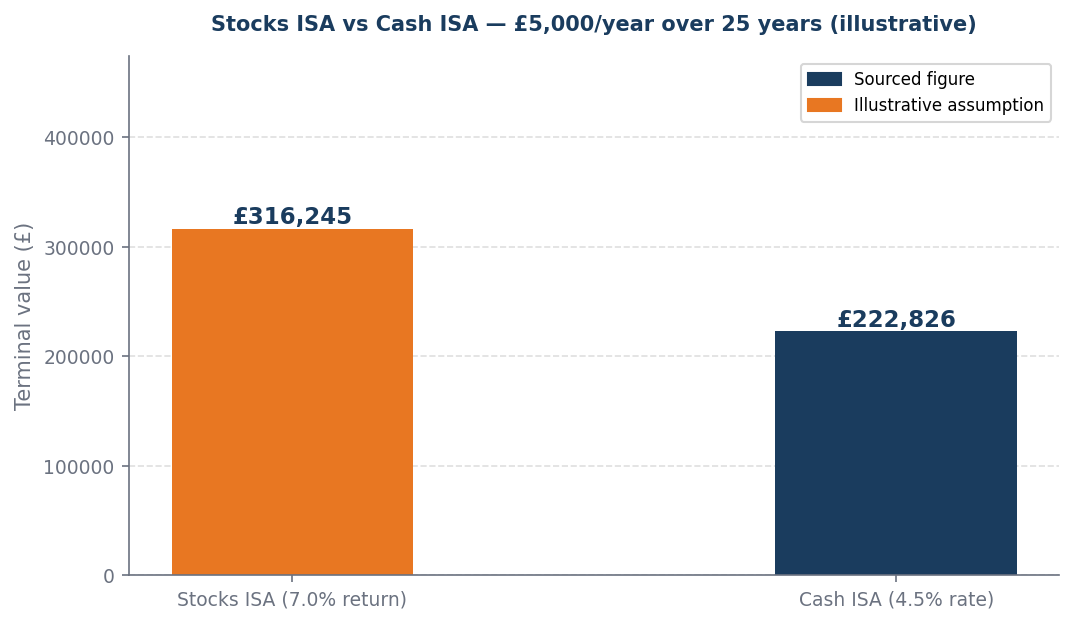
Worked example (illustrative): £5,000/year invested over 25 years. At 7.0% equity return: Stocks ISA = £316,245. At 4.5% cash ISA rate: Cash ISA = £222,826. Stocks ISA produces £93,419 more. Verdict: Stocks ISA wins. Break-even equity return: 4.5%.
When this flips
This flips only when equity returns must stay above 4.5% every year over the full 25-year horizon. If the horizon shortens or the cash ISA rate rises, the likelihood of achieving the desired returns diminishes significantly.
What to do next
| Your situation | Action | Why |
|---|---|---|
| Equity return above break-even | Stocks ISA | Expected return clears the hurdle — compounding wins over the horizon |
| Equity return below break-even | Cash ISA | The certain cash rate beats the uncertain equity return at this level |
| Short horizon under 5 years | Lean cash ISA | Insufficient time to smooth equity volatility — certainty has higher value |
| Long horizon over 15 years | Lean stocks ISA | Compounding over a long runway makes the break-even much easier to clear |
Sources and provenance
Data as of: 2026-04-06