Stocks ISA vs Cash ISA: A Conservative Investor's Dilemma
Verdict
Cash ISA wins
Confidence: High
Break point: Equity return must stay above 4.5% every year over 10 years.
The rate that changes everything
The gap between stocks ISA and cash ISA terminal value widens significantly over longer horizons — compounding is the deciding factor.
The break-even equity return of 4.5% is the critical threshold that determines the superior investment choice between a Cash ISA and a Stocks ISA. If the expected return on equities falls below this rate, the Cash ISA, with its guaranteed 4.5% interest, becomes the clear winner, providing a safer and more reliable yield. Conversely, if equity returns exceed 4.5%, the Stocks ISA outperforms, capitalizing on higher market gains. Therefore, investors must focus on this pivotal return rate to make informed decisions about their investment strategy.
Worked example
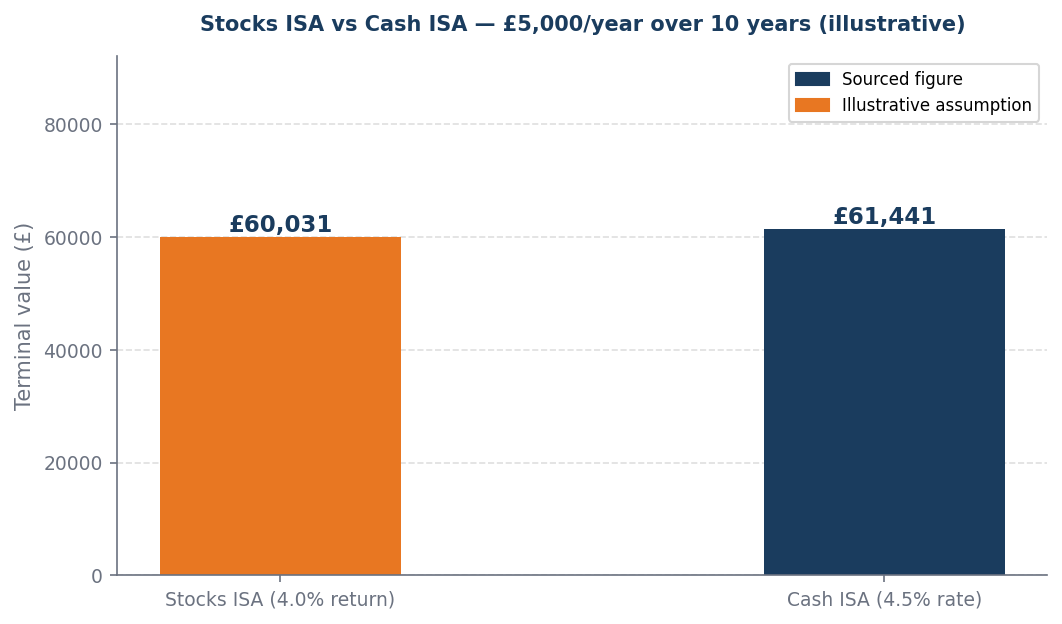
Worked example (illustrative): £5,000/year invested over 10 years. At 4.0% equity return: Stocks ISA = £60,031. At 4.5% cash ISA rate: Cash ISA = £61,441. Cash ISA produces £1,411 more. Verdict: Cash ISA wins. Break-even equity return: 4.5%.
When this flips
This flips only when equity returns must stay above 4.5% every year over the full 10-year horizon. If the horizon shortens or the cash ISA rate rises, the attractiveness of equity investments diminishes significantly.
What to do next
| Your situation | Action | Why |
|---|---|---|
| Equity return above break-even | Stocks ISA | Expected return clears the hurdle — compounding wins over the horizon |
| Equity return below break-even | Cash ISA | The certain cash rate beats the uncertain equity return at this level |
| Short horizon under 5 years | Lean cash ISA | Insufficient time to smooth equity volatility — certainty has higher value |
| Long horizon over 15 years | Lean stocks ISA | Compounding over a long runway makes the break-even much easier to clear |
Sources and provenance
Data as of: 2026-04-06