Why Stocks ISA Outperforms Cash ISA Over 25 Years
Verdict
Stocks ISA wins
Confidence: High
Break point: Equity return must stay above 4.5% every year over 25 years.
The rate that changes everything
The gap between stocks ISA and cash ISA terminal value widens significantly over longer horizons — compounding is the deciding factor.
The break-even equity return of 4.5% is the critical threshold that dictates investment strategy, as it directly compares the performance of a Stocks ISA against a Cash ISA yielding the same rate. If the Stocks ISA generates returns below 4.5%, investors are better off with the Cash ISA, which guarantees a risk-free return. Conversely, any return above 4.5% from the Stocks ISA makes it the superior choice, capitalizing on potential market gains while outpacing the fixed interest of the Cash ISA. Therefore, focus on achieving returns above this benchmark to maximize investment effectiveness.
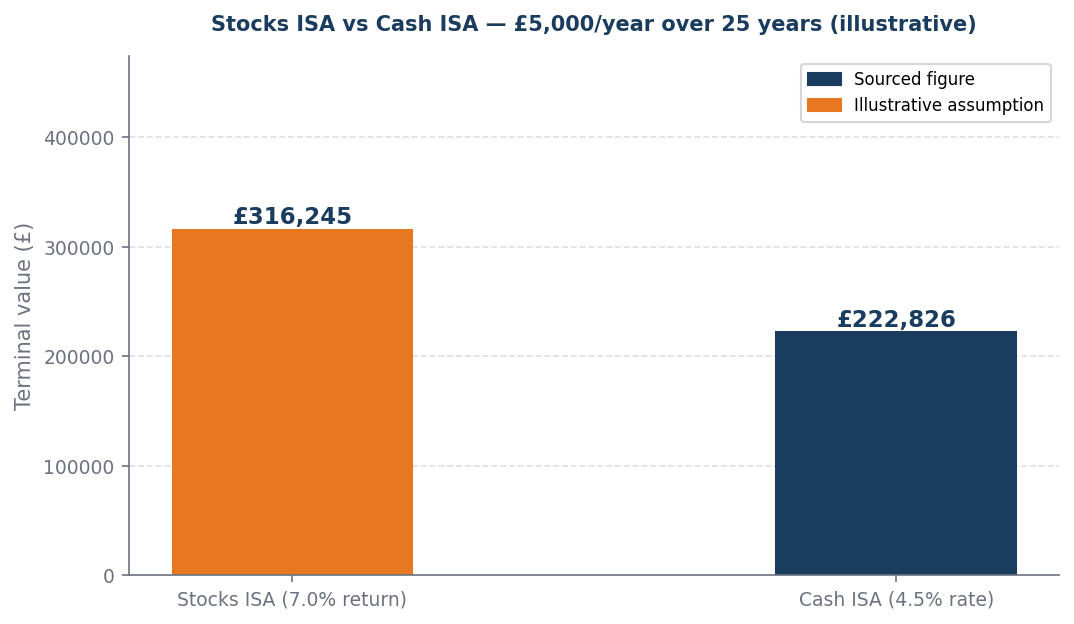
Worked example
Worked example (illustrative): £5,000/year invested over 25 years. At 7.0% equity return: Stocks ISA = £316,245. At 4.5% cash ISA rate: Cash ISA = £222,826. Stocks ISA produces £93,419 more. Verdict: Stocks ISA wins. Break-even equity return: 4.5%.
When this flips
This flips only when equity returns must stay above 4.5% every year over the full 25-year horizon. If the horizon shortens or the cash ISA rate rises, the likelihood of achieving the desired returns diminishes significantly.
What to do next
| Your situation | Action | Why |
|---|---|---|
| Equity return above break-even | Stocks ISA | Expected return clears the hurdle — compounding wins over the horizon |
| Equity return below break-even | Cash ISA | The certain cash rate beats the uncertain equity return at this level |
| Short horizon under 5 years | Lean cash ISA | Insufficient time to smooth equity volatility — certainty has higher value |
| Long horizon over 15 years | Lean stocks ISA | Compounding over a long runway makes the break-even much easier to clear |
Sources and provenance
Data as of: 2026-04-06