Stocks ISA vs Cash ISA: Which is Right for You?
Verdict
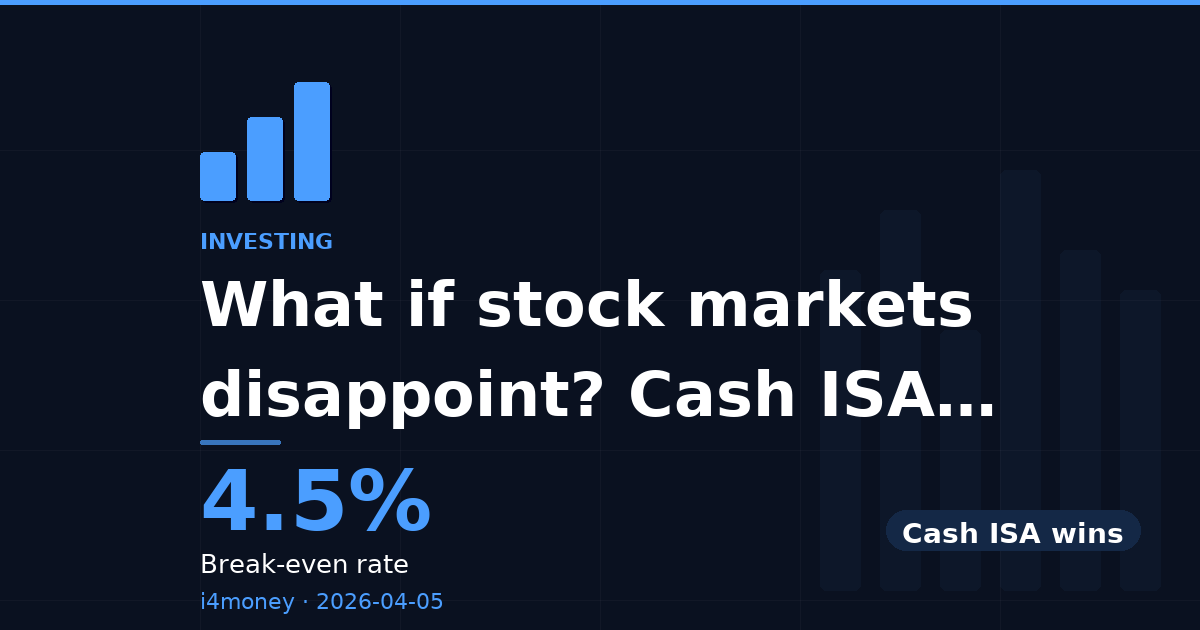
Cash ISA wins
Confidence: High
Break point: Equity return must stay above 4.5% every year over 10 years.
The rate that changes everything
The gap between stocks ISA and cash ISA terminal value widens significantly over longer horizons — compounding is the deciding factor.
The break-even equity return of 4.5% is the definitive threshold for determining the superior investment option between a Cash ISA and a Stocks ISA. If the expected return on equities falls below this rate, the Cash ISA, offering a guaranteed 4.5% return, is the clear winner, providing safety and certainty. Conversely, should equity returns exceed 4.5%, the Stocks ISA becomes the more lucrative choice, capitalizing on higher potential gains. Therefore, investors must focus solely on this critical figure to guide their decision-making.
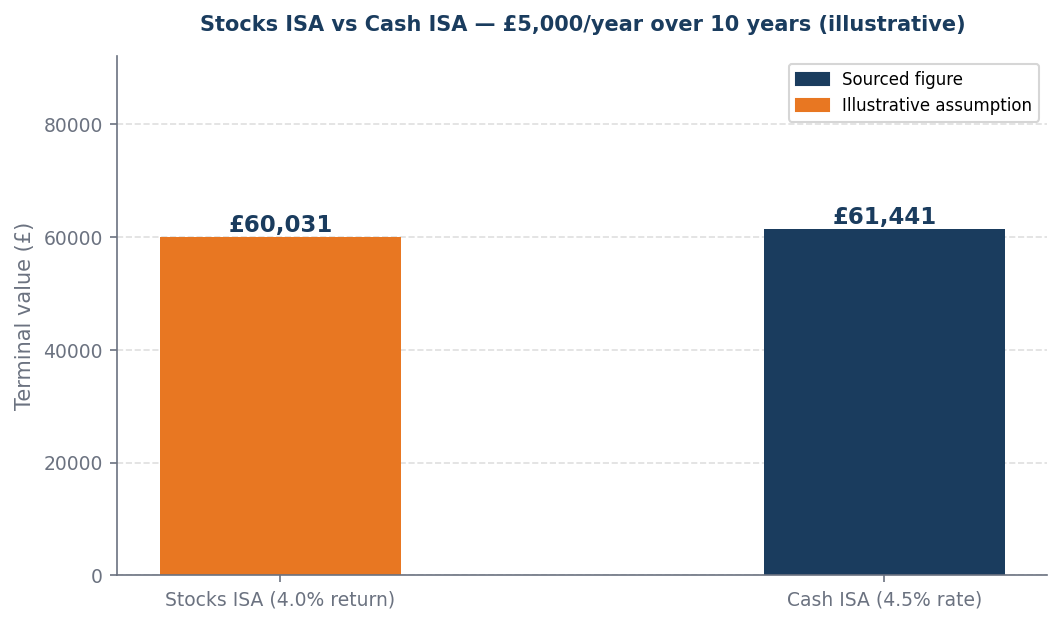
Worked example
Worked example (illustrative): £5,000/year invested over 10 years. At 4.0% equity return: Stocks ISA = £60,031. At 4.5% cash ISA rate: Cash ISA = £61,441. Cash ISA produces £1,411 more. Verdict: Cash ISA wins. Break-even equity return: 4.5%.
When this flips
This flips only when equity returns must stay above 4.5% every year over the full 10-year horizon. If the horizon shortens or the cash ISA rate rises, the attractiveness of equities diminishes, leading to potential capital outflows.
What to do next
| Your situation | Action | Why |
|---|---|---|
| Equity return above break-even | Stocks ISA | Expected return clears the hurdle — compounding wins over the horizon |
| Equity return below break-even | Cash ISA | The certain cash rate beats the uncertain equity return at this level |
| Short horizon under 5 years | Lean cash ISA | Insufficient time to smooth equity volatility — certainty has higher value |
| Long horizon over 15 years | Lean stocks ISA | Compounding over a long runway makes the break-even much easier to clear |
Sources and provenance
Data as of: 2026-04-06