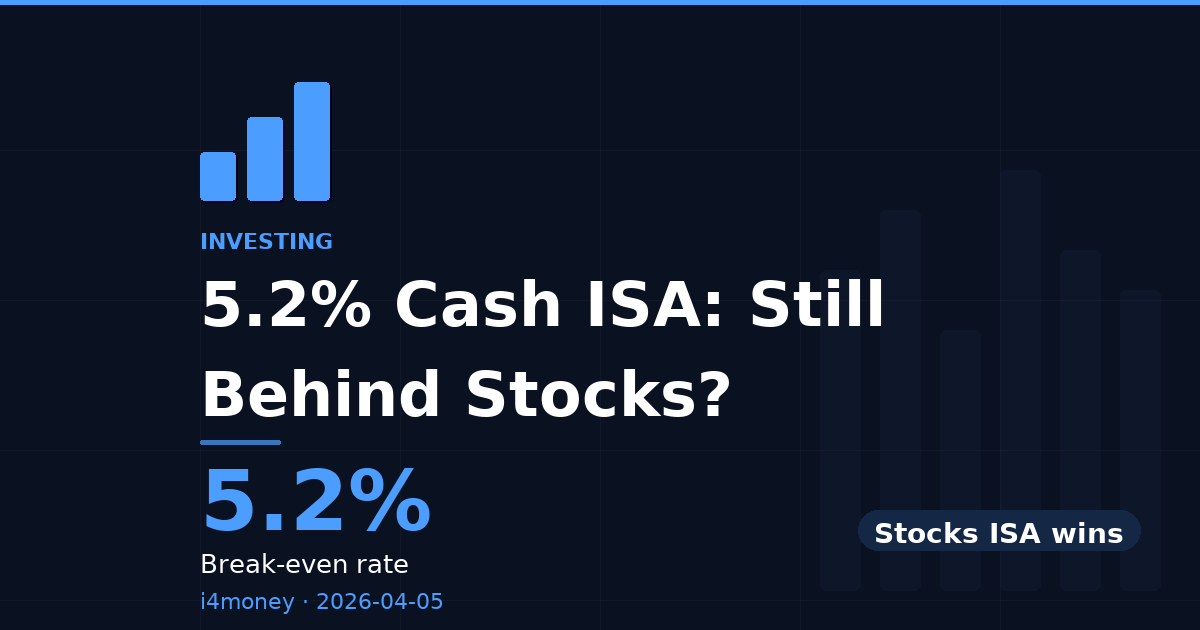
Cash ISA vs Stocks ISA: Which is Better Now?
Verdict
Stocks ISA wins
Confidence: High
Break point: Equity return must stay above 5.2% every year over 10 years.
The rate that changes everything
The gap between stocks ISA and cash ISA terminal value widens significantly over longer horizons — compounding is the deciding factor.
The break-even equity return of 5.2% is the definitive threshold for determining the superior investment choice between a Stocks ISA and a Cash ISA. If the expected return on stocks falls below this rate, the Cash ISA, with its guaranteed 5.2% interest, becomes the more favorable option. Conversely, any anticipated return above 5.2% from the Stocks ISA makes it the clear winner, as it offers the potential for greater growth despite market volatility. Therefore, investors must focus solely on this critical return figure to guide their decision-making.
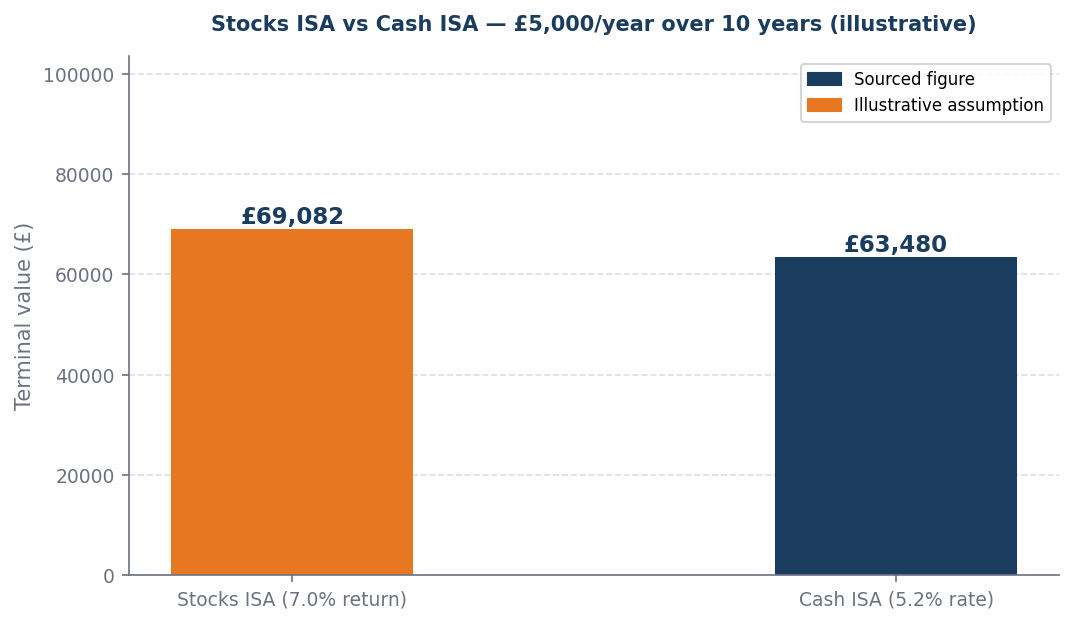
Worked example
Worked example (illustrative): £5,000/year invested over 10 years. At 7.0% equity return: Stocks ISA = £69,082. At 5.2% cash ISA rate: Cash ISA = £63,480. Stocks ISA produces £5,603 more. Verdict: Stocks ISA wins. Break-even equity return: 5.2%.
When this flips
This flips only when equity returns must stay above 5.2% every year over the full 10-year horizon. If the horizon shortens or the cash ISA rate rises, the attractiveness of equities diminishes significantly.
What to do next
| Your situation | Action | Why |
|---|---|---|
| Equity return above break-even | Stocks ISA | Expected return clears the hurdle — compounding wins over the horizon |
| Equity return below break-even | Cash ISA | The certain cash rate beats the uncertain equity return at this level |
| Short horizon under 5 years | Lean cash ISA | Insufficient time to smooth equity volatility — certainty has higher value |
| Long horizon over 15 years | Lean stocks ISA | Compounding over a long runway makes the break-even much easier to clear |
Sources and provenance
- OECD_EO_116.pdf
- boe_mpr_2026_02.pdf
Data as of: 2026-04-06